Understanding the basics of the income statement is the first step to understanding fundamental analysis
The income statement is the financial report that shows investors how sales (top line) and expenses are being turned into net income (bottom line.) The income statement is sometimes called a P&L (Profit and Loss) statement and is one of the three key financial statements released to the public each quarter. The most popular financial metric, earnings, comes from the bottom line of the income statement, which makes this an important report to understand.
Part One: Using the income statement
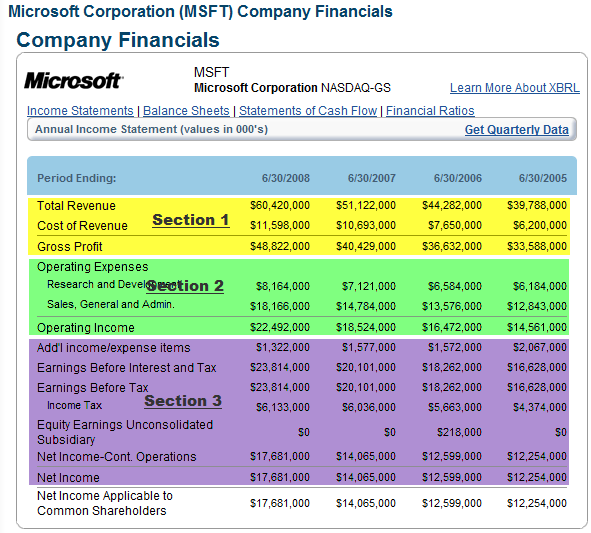
The income statement typically has three sections.
1. The first section shows total revenue or sales minus the cost of goods sold or cost of sales. The result of this small equation is often called gross profit or gross margin.
2. The second section includes operating expenses such as selling, administration, research and development. Once these expenses are deducted from gross profit the result is known as operating profit or operating margin.
3. In the third section taxes, interest and special charges are deducted from the operating profit and the result is known as net income, earnings or profit.
The income statement will contain several individual line items but they will each fall within one of these three categories. In the image below, you can see these sections in the income statement for Microsoft (MSFT).

The way that a company reports information on the income statement can be somewhat misleading. Here are a few examples of ways that investors can be distracted from the numbers that really matter on the income statement.
1. Revenue does not equal cash inflow. The gross revenue numbers or sales shown on the income statement can understate or overstate the actual cash flow from the company’s marketing efforts. Sometimes the difference it very material and can give a misleading picture of corporate performance.
2. Earnings before interest and income taxes and sometimes depreciation and amortization (EBIT/EBITDA) are sometimes emphasized in an earnings report to make the performance picture look a little better than the actual net income number.
3. Net income does not equal dividends. Just because a company is profitable does not mean they are returning any that income to their owners (shareholders) through dividends. In today’s world of long term flat returns on stock prices, dividends are becoming even more important.
4. There are two ways to increase earnings or net income. Cutting costs will increase net income if sales are flat but it is not sustainable in the long term. Increasing sales numbers can increase net income and is usually a better indicator of growth potential than cutting costs.
Once you understand some of these issues it is easier to see why the information on the income statement is best when used with the information on the other financial statements. In this article I will be covering each financial statement and will help you understand how to use them to improve your searching and analysis.
Understanding the basics of the cash flow statement is the second step to understanding fundamental analysis
I like to think of the statement of cash flows as the real income statement. Neither financial statement can really stand completely on its own but the statement of cash flows gives you that critical look at the actual cash that is flowing into and out of a company. If and how fast that cash flow is growing is a critical piece of information as you conduct your analysis.
Part Two: Using the cash flow statement
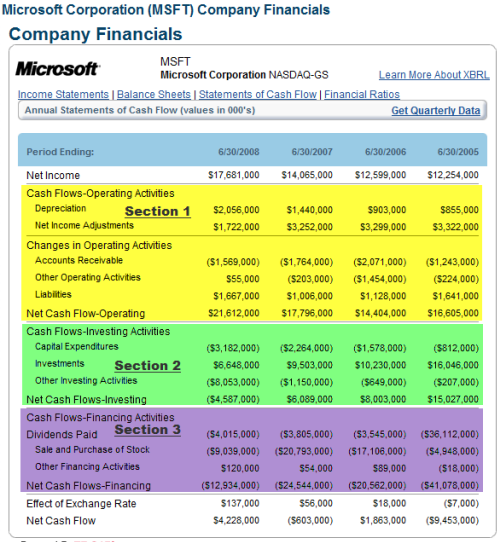
The cash flow statement has three sections. Each of these sections reconcile the information on the income statement with the information on the balance sheet. To begin that reconciliation, the statement of cash flows begins with the net income number from the income statement.
Net income is then increased or reduced with as it flows through the three sections of the statement of cash flows.
1. The statement of cash flows begins with cash flow from operating activities. At this point non-cash expenses like depreciation and amortization are added back to net income. Uncollected cash like accounts receivable is deducted because although those sales were included in revenue or net income no cash has been collected yet.
2. The second section of the statement of cash flows tracks investing activities. The largest componenets of this category includes money spent on acquisition of capital assets like property, plants and equipment. If applicable, loans or investments made to customers and suppliers are also included here as outlays of cash.
3. The final section includes financing activities. For example, if a company issues stock, the proceeds of that offering will be added to cash in this category. Dividends paid are also included here as are payments on the principle of debt owed by the company.
The statement of cash flows will contain several individual line items but they will each fall within one of these three categories. Once these three categories of cash flows have been accounted for, the end result is a net increase or decrease in cash for the period. This is an important number to understand.
Because of the rules around how and when you can recognize revenue or sales, it is not uncommon to see a company that appears to not be making much net income or earnings to be accumulating a lot of cash. This speaks to one of the issues with the income statement. When and how a company recognizes revenue can be a little misleading unless you are also watching the increase or decrease in cash from period to period.
In the image below, you can see these sections in the statement of cash flows for Microsoft (MSFT).

While the statement of cash flows can be extremely revealing and is easier to understand than the income statement, there are two things to keep in mind while reading the report.
1. As a shareholder you should be concerned not only with how much cash is growing but the dividends paid by the company as well. It is usually a good idea to include dividends paid when evaluating the net increase in cash as that is a clear benefit to shareholders.
2. You will often hear analysts refer to “free cash flow” or “free cash flow per share” as a measure of financial performance but that it not equal to the net increase or decrease to cash at the bottom of the cash flow statement. Free cash flow excludes financing activities and it may not be a complete picture of the cash generating abilities of the company being analyzed.
The cash flow statement is just one of the three primary reports issued to shareholders and should not be analyzed all by itself. However, when used with the income statement and balance sheet a solid picture of the overall financial performance of the company will begin to emerge.
The balance sheet shows investors the value of the companies assets, liabilities (debt) and owners equity. It is called a balance sheet because total assets will always equal or balance to liabilities plus owners equity. The balance sheet shows investors the net asset (book value) of the firm. It also helps investors and owners understand how the company is financing operations whether through debt or income.
Part Three: Using the balance sheet
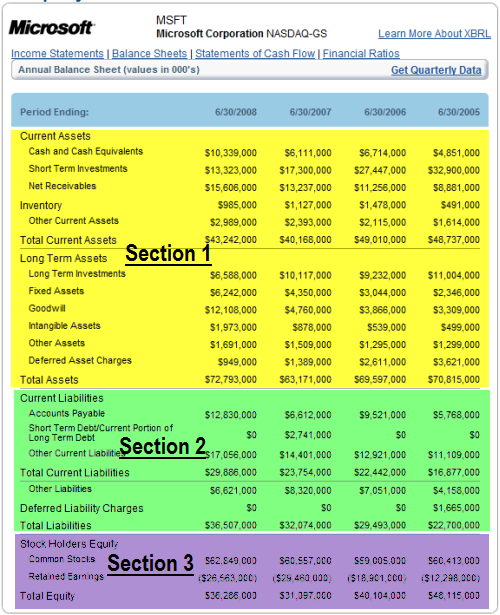
The balance sheet has three sections
1. The first section is current and long term assets. A current asset is usually defined as cash or anything that will be turned into cash within a year. Accounts receivable is a non-cash example of a current asset.
Long term assets include property, plant and equipment. The assets portion of the balance sheet is affected by changes to the cash flow statement as money is invested in long term assets or as customers run up receivables with the firm.
2. Liabilities are the second section of the balance sheet. Liabilities or debt are those obligations that the firm owes to other parties, employees or the government.
Short term liabilities include anything that must be paid within a year such as accounts payable or short term notes. The liabilities section of the balance sheet shows investors how management is using debt to finance the firm’s operations.
3. The third section of the balance sheet is owners equity. When owners equity is added to liabilities the sum will be equal to assets. Therefore, owners equity is the “net asset value” or the firm’s book value.
Some analysts will insist that intangible assets must also be excluded to arrive at a true book value for a firm. Owners equity can be reduced through dividend payments and losses.
In the image below, you can see these sections of the balance sheet for Microsoft (MSFT).

There are a few things to keep in mind about the balance sheet as you begin using them in your analysis.
1. The relative size of owners equity compared to debt can give you some insight about how a company is financing its operations. Very large debt balances can increase a firm’s sensitivity to interest rate changes and credit availability.
2. Retained earnings within owners equity can be reduced by losses during the quarter. The company’s performance as a function of its equity is a critical fundamental measure.
3. The assets portion of the balance sheet can contain large amounts of “intangible assets.” Usually these assets (such as goodwill) are not an issue but when they become disproportionate when compared to other current and long term assets it can be troubling. This was a major warning sign that the “roll-ups” of the early 2000’s were no more than a shell game.
Once you understand some of these issues it is easier to see why the information on the balance sheet is best when used with the information on the other financial statements. In this series of articles we will be covering each financial statement and will help you understand how to use them to improve your searching and analysis.